Hands-on with VictoriaStack on Docker Compose and Kubernetes
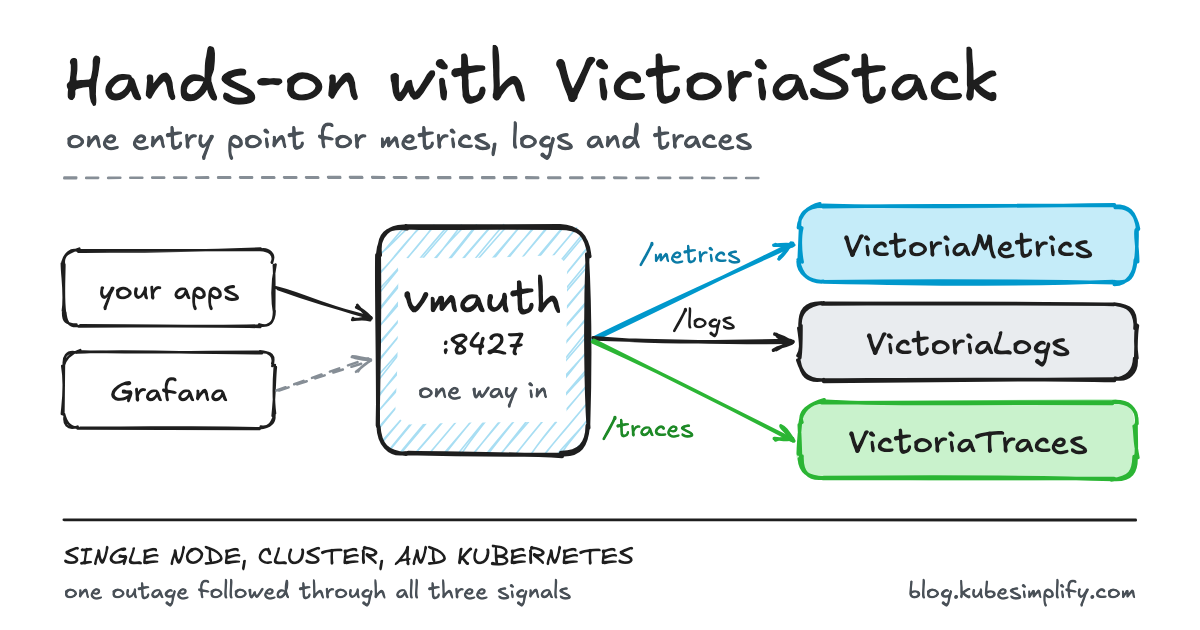
We run VictoriaStack on a laptop, query metrics, logs, and traces through one entry point, stop a service and find the cause, then try Kubernetes with kind.

On this page (21)
- What is VictoriaStack?
- Prerequisites
- Step 1: Start the stack
- Step 2: One entry point for three databases
- The web interfaces
- Step 3: One Collector for all three signals
- Step 4: First queries
- Metrics
- Logs
- Traces
- Step 5: Break something and find the cause
- What do the logs say?
- What do the traces say?
- The alert fires
- The same trace in Grafana
- Fix it
- Step 6: The cluster version
- Step 7: Kubernetes with kind and Helm
- A few things to know
- Wrapping up
- Credits and links
How many places do you send telemetry to today? If you keep metrics, logs, and traces, the answer is often three, and each one has its own install, ports, and way to get data in. And when something breaks, you have to look in all three to find out why.
On 10 November 2026, the VictoriaMetrics team introduced VictoriaStack. It is three databases, one for each kind of telemetry data: VictoriaMetrics for metrics, VictoriaLogs for logs, and VictoriaTraces for traces. All three sit behind one entry point, and one OpenTelemetry pipeline sends data to all of them.
This post is hands-on. We will:
- start VictoriaStack on a laptop with two commands
- see how one entry point reaches all three databases
- run a first query for metrics, logs, and traces
- stop a service and find the cause with all three
- try the cluster version
- install the stack on Kubernetes with kind and Helm
What is VictoriaStack? #
VictoriaStack is three open-source databases that are documented and deployed together. All three are Apache 2.0 licensed.
| Data | Database | Query language | Default port |
|---|---|---|---|
| Metrics | VictoriaMetrics | MetricsQL | 8428 |
| Logs | VictoriaLogs | LogsQL | 9428 |
| Traces | VictoriaTraces | LogsQL, Jaeger API, Tempo API (experimental) | 10428 |
Metrics, logs, and traces are often called the three signals. They all arrive as telemetry with a timestamp, so one database for everything sounds simpler. But they behave very differently once you store and query them:
- Metrics are small numbers that arrive at a steady pace. The hard part is the number of series, which keeps changing as pods come and go.
- Logs are large pieces of text. The hard part is writing them fast and searching for words across weeks of data.
- Traces are trees of spans spread over many services. The hard part is the write volume and finding one trace quickly.
One general-purpose database would need a single storage format for all three, and it would suit none of them well. You would pay for it in memory, disk, and query time. So each signal gets its own database, with storage and a query engine built for how that data is written and read.
On top of three separate databases, the stack adds three things:
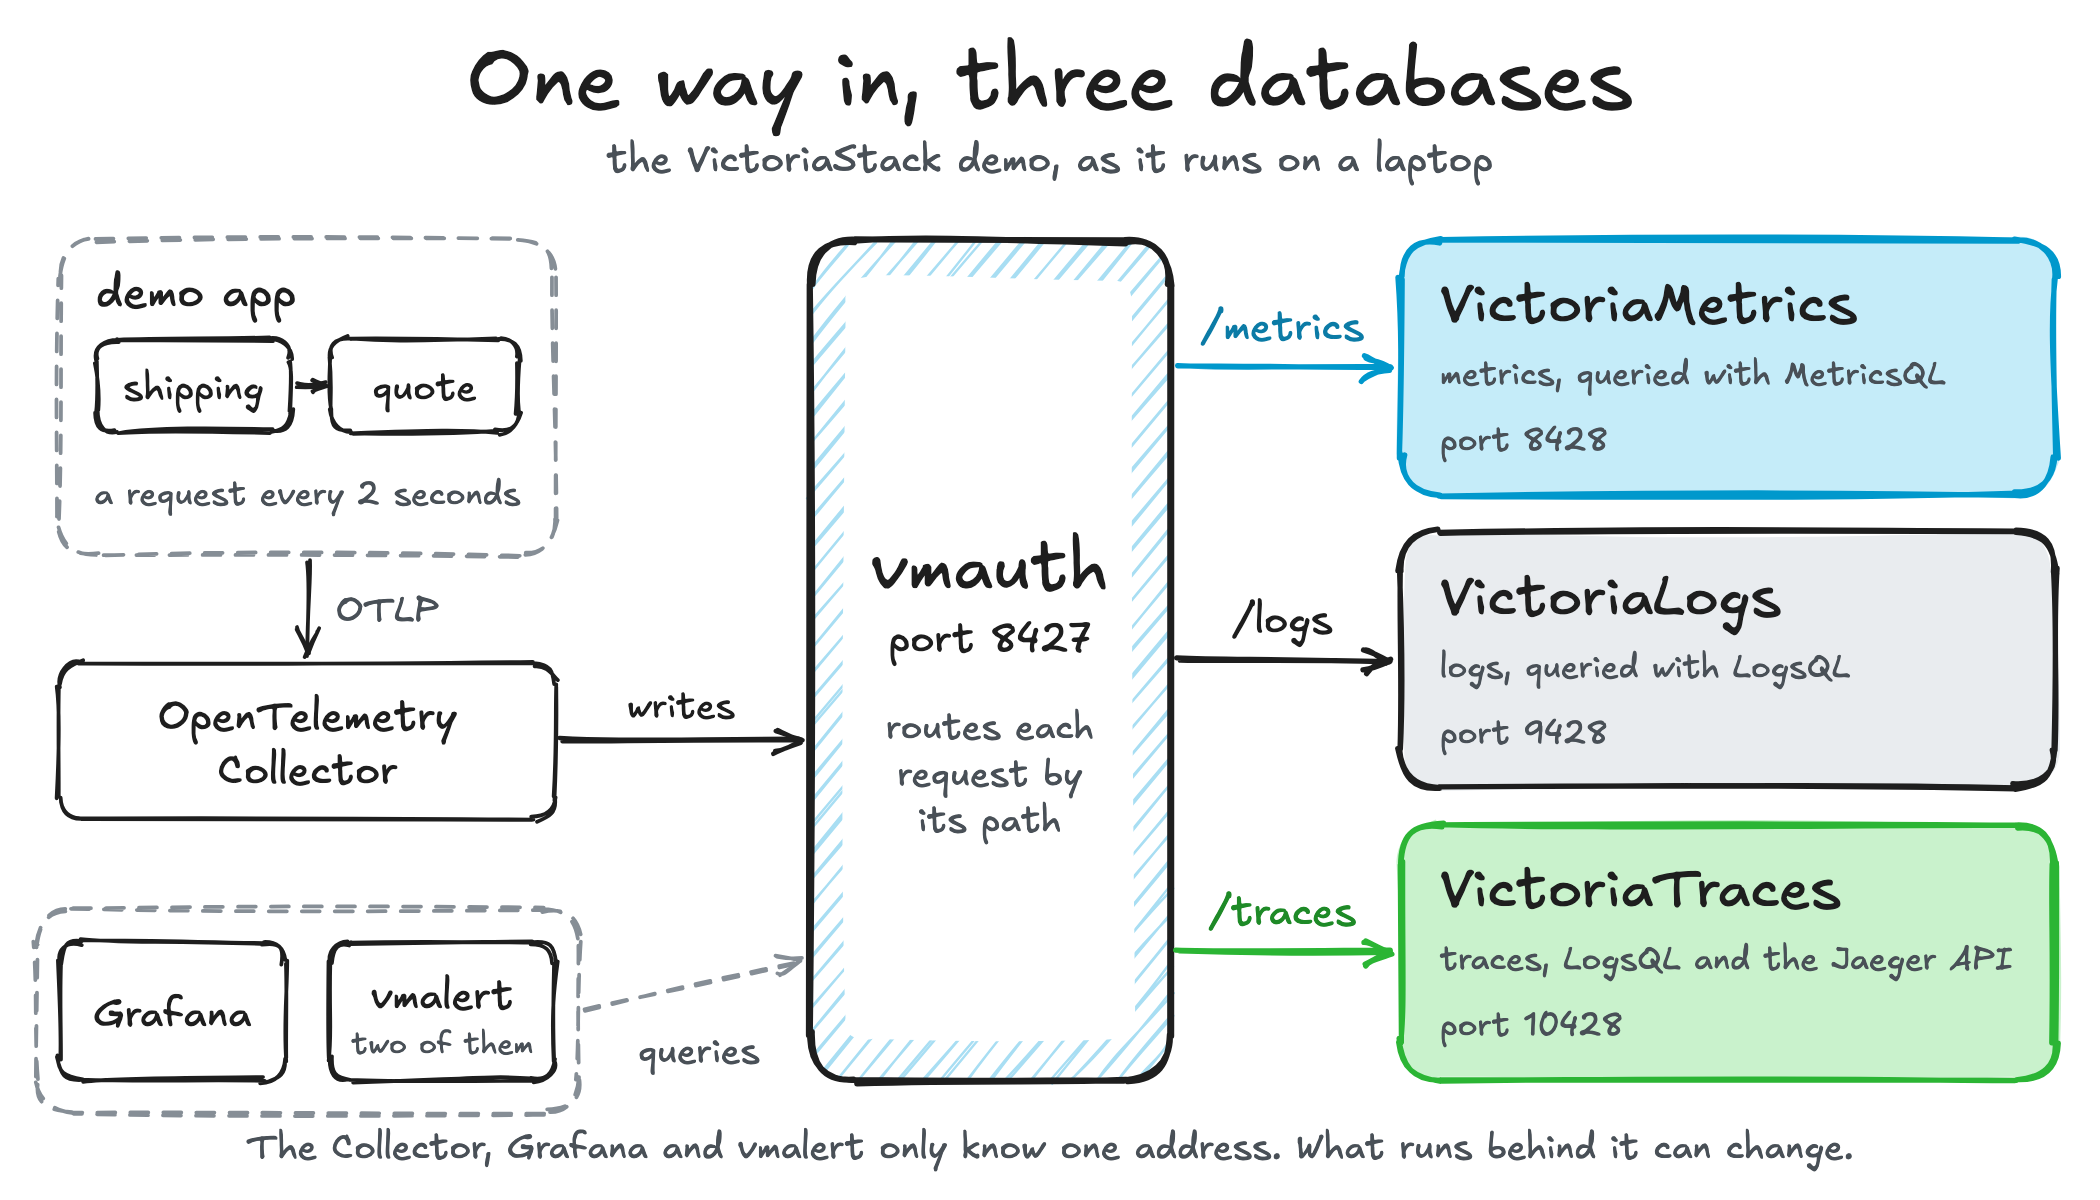
- One entry point. vmauth, a small proxy, sits in front and sends each request to the right database by its path.
- One pipeline. All three databases accept OTLP, the OpenTelemetry protocol. So one OpenTelemetry Collector can send data to all of them.
- The same tools to deploy and alert. One Helm chart installs all of them on Kubernetes, and vmalert, the program that runs alerting rules, works with all of them.
Think of an office building with three departments, one on each floor. You don't want three entrances and three addresses. You want one front desk that sends you to the right floor. vmauth is that front desk, and the path of your request (/metrics, /logs, or /traces) says which floor you want.
Prerequisites #
You need:
- git, make,
curl, andjq - Docker with Compose
- for the Kubernetes part: kind, kubectl, and Helm
The commands in this post were run on a MacBook Pro (Apple M1 Max) with Docker Desktop 4.75.0. The VictoriaStack repo was at commit 5c1df0b. Its single-node Compose file uses VictoriaMetrics v1.156.0, VictoriaLogs v1.54.0, and VictoriaTraces v0.13.0.
Step 1: Start the stack #
Clone the repo and run one make command:
$ git clone https://github.com/VictoriaMetrics/VictoriaStack.git && cd VictoriaStack
Cloning into 'VictoriaStack'...

$ make otel-single-up
docker compose \
	-f deployment/otel-single-node.yml \
 	-f deployment/otel-demo-mini.yml \
 	up -d
...
 Container deployment-shipping-1 Started
 Container deployment-traffic-1 Starting
Container deployment-traffic-1 Started The above commands pull the images and start the stack.
Warning: This Compose setup is a demo for your own machine. It publishes its ports on every network interface, and neither the databases nor the entry point ask for a password. So run it only on a laptop or a test machine that cannot be reached from the internet. This is not the way to run VictoriaStack in production. For that, start with the deployment and access control docs.
Now let's see what is running:
$ docker ps --filter name=deployment --format 'table {{.Names}}\t{{.Image}}\t{{.Status}}'
NAMES                          IMAGE                                         STATUS
deployment-traffic-1           curlimages/curl:8.12.1                        Up 5 seconds
deployment-shipping-1          ghcr.io/open-telemetry/demo:3.0.0-shipping    Up 5 seconds
deployment-victorialogs-1      victoriametrics/victoria-logs:v1.54.0         Up 6 seconds
deployment-flagd-1             ghcr.io/open-feature/flagd:v0.16.0            Up 5 seconds
deployment-quote-1             ghcr.io/open-telemetry/demo:3.0.0-quote       Up 6 seconds
deployment-vmstack-1           victoriametrics/vmauth:v1.156.0               Up 5 seconds
deployment-victoriatraces-1    victoriametrics/victoria-traces:v0.13.0       Up 5 seconds
deployment-victoriametrics-1   victoriametrics/victoria-metrics:v1.156.0     Up 5 seconds
deployment-rules-metrics-1     victoriametrics/vmalert:v1.156.0              Up 5 seconds
deployment-rules-logs-1        victoriametrics/vmalert:v1.156.0              Up 6 seconds
deployment-grafana-1           grafana/grafana:latest                        Up 6 seconds
deployment-otelcol-1 otel/opentelemetry-collector-contrib:latest Up 5 secondsThere are 12 containers:
victoriametrics,victorialogs, andvictoriatracesare the three databases.vmstackis vmauth, the entry point on port 8427.rules-metricsandrules-logsare two vmalert instances. The first one runs the alerting rules, and the second one turns logs into metrics.otelcolis the OpenTelemetry Collector.grafanais Grafana, with data sources and a dashboard already set up.shippingandquoteare two services from the OpenTelemetry demo.trafficcallsshippingevery two seconds, andshippingasksquotefor a price.flagdserves feature flags toshipping.
Wait three or four minutes before the next step, so that there is some data to query.
Step 2: One entry point for three databases #
Everything goes through http://localhost:8427, which is vmauth. Its config file says where each request goes. Let's look at the first 21 lines:
$ sed -n '1,21p' deployment/config/vmauth/single-node.yml
unauthorized_user:
  url_map:
    # VictoriaMetrics access
    - src_paths: ["/metrics/select/.*"]
      drop_src_path_prefix_parts: 2
      url_prefix:
        - "http://victoriametrics:8428"
    - src_paths: ["/metrics/insert/.*"]
      drop_src_path_prefix_parts: 2
      url_prefix:
        - "http://victoriametrics:8428"

    # VictoriaLogs access
    - src_paths: ["/logs/select/.*"]
      drop_src_path_prefix_parts: 1
      url_prefix:
        - "http://victorialogs:9428"
    - src_paths: ["/logs/insert/.*"]
      drop_src_path_prefix_parts: 1
      url_prefix:
- "http://victorialogs:9428"Each rule matches the start of a request path and names the database that gets the request. select is for reading data, and insert is for writing it. Before vmauth passes a request on, drop_src_path_prefix_parts removes that many parts from the front of its path. The number is not the same for every database:
- For metrics, it is 2. VictoriaMetrics serves its API from the root, so both
/metricsand/selectare removed. A query sent to/metrics/select/prometheus/api/v1/queryreaches VictoriaMetrics as/prometheus/api/v1/query. - For logs, it is 1. VictoriaLogs has
/selectand/insertin its own API paths, so only/logsis removed. A query sent to/logs/select/logsql/queryreaches VictoriaLogs as/select/logsql/query.
The rules for /traces come next in the file, and they work like the ones for logs.
The docs write these rules another way. The access control page matches /metrics/.* and removes one part, so there the same query goes to /metrics/prometheus/api/v1/query, with no select in the path. Both ways work. Pick one and stay with it.
There are no users or passwords in this file. In a real setup, vmauth is where you add them, and the same access control page shows how.
To keep the commands short, let's save three small helpers in a file called helpers.sh:
# Three small helpers. Each one goes through the same entry point: vmauth on port 8427.
V=http://localhost:8427

# MetricsQL, through /metrics
mq() { curl -s "$V/metrics/select/prometheus/api/v1/query" --data-urlencode "query=$1" | jq -c '.data.result[] | {metric, value: .value[1]}'; }

# LogsQL over logs, through /logs
lq() { curl -s "$V/logs/select/logsql/query" --data-urlencode "query=$1"; }

# LogsQL over traces, through /traces
tq() { curl -s "$V/traces/select/logsql/query" --data-urlencode "query=$1"; }Now load them into your shell. Do this again whenever you open a new terminal:
$ source helpers.shAll three helpers use the same host and port. The first part of the path picks the database.
The web interfaces #
Each database also comes with its own web interface, called VMUI. The three interfaces are behind the same entry point:
| Database | Web interface |
|---|---|
| VictoriaMetrics | http://localhost:8427/metrics/select/vmui/ |
| VictoriaLogs | http://localhost:8427/logs/select/vmui/ |
| VictoriaTraces | http://localhost:8427/traces/select/vmui/ |
Grafana is at http://localhost:3000 (log in with admin and admin), with a data source for each database.
Every query in this post can be typed into these interfaces too. We use curl so that you can copy the commands and compare the output, and we open the interfaces in Step 5.
Step 3: One Collector for all three signals #
Now let's see how the data gets in. The demo app sends everything to the OpenTelemetry Collector over OTLP, and the Collector passes it on. Each place it sends data to is called an exporter. Let's see where the exporters point:
$ grep -o '[a-z]*_endpoint: [^ ,]*' deployment/config/otelcollector/config.yml
metrics_endpoint: http://vmstack:8427/metrics/insert/opentelemetry/v1/metrics
logs_endpoint: http://vmstack:8427/logs/insert/opentelemetry/v1/logs
logs_endpoint: http://vmstack:8427/logs/insert/opentelemetry/v1/logs
traces_endpoint: http://vmstack:8427/traces/insert/opentelemetry/v1/tracesEvery endpoint has the same host and port. vmstack:8427 is vmauth inside the Compose network, and again, the path picks the database.
The logs endpoint is listed twice because the demo sends the logs a second time, to another tenant. A tenant is a separate space for data inside the same database, for example one for each team or customer. A request picks its tenant with two HTTP headers, AccountID and ProjectID, and a query for one tenant never returns the data of another. Without the headers, a request gets tenant 0:0, which is why our helpers need none. The demo writes its logs to tenants 0:0 and 1:0, and we will read the second copy in Step 4.
If you already run a Collector, this is the part you add to your own setup: one exporter for each database.
Step 4: First queries #
Metrics #
MetricsQL is the query language of VictoriaMetrics. It is backward-compatible with PromQL, the Prometheus query language, so the PromQL queries you already know should work here. It does not work the other way round, as we will see in a moment. Let's ask how many requests per second each route gets:
$ mq 'sum(rate(http.server.request.duration_count[1m])) by (http.route)'
{"metric":{"http.route":"/get-quote"},"value":"0.4999333422210372"}Half a request per second, because traffic calls shipping every two seconds. The metric name has dots in it because it comes from OpenTelemetry, and VictoriaMetrics keeps such names as they are. Writing them without quotes is something MetricsQL adds. PromQL does not accept it, so this query would fail in Prometheus. There, a name with dots has to be quoted, as in {__name__="http.server.request.duration_count"}, which MetricsQL accepts too.
Logs #
LogsQL is the query language of VictoriaLogs. A query starts with a filter, and after each | comes a step that reshapes the result. Let's count the log records of the last two minutes by service and message:
$ lq '_time:2m | stats by (service.name, _msg) count() as logs'
{"service.name":"quote","_msg":"Calculated quote","logs":"58"}
{"service.name":"shipping","_msg":"Sending Quote","logs":"58"}
{"service.name":"shipping","_msg":"Requesting quote","logs":"58"}For every request, shipping writes "Requesting quote" and "Sending Quote", and quote writes "Calculated quote". Remember these three lines. We will come back to them in Step 5.
In Step 3, we saw that the demo also writes its logs to tenant 1:0. To read that copy, we send the same query with the AccountID header:
$ curl -s -H 'AccountID: 1' $V/logs/select/logsql/query --data-urlencode 'query=_time:2m | stats by (service.name, _msg) count() as logs'
{"service.name":"quote","_msg":"Calculated quote","logs":"59"}
{"service.name":"shipping","_msg":"Sending Quote","logs":"59"}
{"service.name":"shipping","_msg":"Requesting quote","logs":"59"}The same three lines come back, this time from the other tenant. (The counts are one higher only because this query ran five seconds later.)
The demo also turns logs into a metric. One of its vmalert rules counts the log records of each service every minute and saves the result in VictoriaMetrics:
$ mq 'service_name:logs_count:1m'
{"metric":{"__name__":"service_name:logs_count:1m","service.name":"quote","stats_result":"count(*)"},"value":"30"}
{"metric":{"__name__":"service_name:logs_count:1m","service.name":"shipping","stats_result":"count(*)"},"value":"60"}That is 30 records a minute from quote and 60 from shipping.
Traces #
VictoriaTraces supports the Jaeger API. Jaeger is a well-known open-source tracing tool, so tools like Grafana can read traces from VictoriaTraces. Let's list the services it knows:
$ curl -s $V/traces/select/jaeger/api/services
{"data":["flagd","quote","shipping"],"errors": null,"limit": 0,"offset": 0,"total":3}VictoriaTraces also understands LogsQL. A trace is made of spans (a span is one timed step of a request), and VictoriaTraces stores spans the same way VictoriaLogs stores log records. So we can count the spans by name with the language we just used for logs. The name:* filter keeps only the records that have a span name:
$ tq '_time:5m name:* | stats by (name) count() as spans'
{"name":"calculate-quote","spans":"128"}
{"name":"flagSync","spans":"1"}
{"name":"{closure}","spans":"128"}
{"name":"POST /getquote","spans":"128"}
{"name":"POST /get-quote","spans":"128"}
{"name":"POST quote","spans":"128"}Step 5: Break something and find the cause #
Now let's create an incident. shipping needs the quote service for every request, so let's stop it:
$ docker stop deployment-quote-1
deployment-quote-1Wait two minutes, and then look at the requests by HTTP status code:
$ mq 'sum(rate(http.server.request.duration_count[1m])) by (http.response.status_code)'
{"metric":{"http.response.status_code":"200"},"value":"0"}
{"metric":{"http.response.status_code":"500"},"value":"0.4999333422210372"}The rate of status 200 is zero, and status 500 is at half a request per second. So every request now fails. The demo comes with alert rules, so let's see what they say:
$ curl -s $V/metrics/select/prometheus/api/v1/alerts | jq -c '.data.alerts[] | {alert: .labels.alertname, state}'
{"alert":"RequestErrorsRatioHigh","state":"pending"}
{"alert":"HighRequestLatency","state":"firing"}RequestErrorsRatioHigh is pending: its condition is true, but not for long enough yet. The rule needs more than 5% of a service's requests to fail with a 5xx status (500 to 599) for five minutes. After that, the alert is firing. (HighRequestLatency fires all the time in this demo, so ignore it. More on that at the end.)
What do the logs say? #
The metrics tell us that requests fail. They do not tell us why. The logs are where most of us look next, so let's run the logs query from Step 4 again:
$ lq '_time:2m | stats by (service.name, _msg) count() as logs'
{"service.name":"shipping","_msg":"Requesting quote","logs":"59"}Two of the three lines are gone. quote writes nothing at all. shipping still writes "Requesting quote" for every request, but it never gets to "Sending Quote". When did quote go quiet? Let's ask for its last record:
$ lq 'service.name:=quote | sort by (_time desc) | limit 1 | fields _time, _msg'
{"_time":"2026-11-20T01:54:54.813445Z","_msg":"Calculated quote"}That is the last request before we stopped the container. So the logs tell us when the trouble started and which service went quiet. But there is no error in them. shipping logs nothing about the failure, so we still don't know why its requests fail. To find out, we have to look inside one request, and that is what traces are for.
What do the traces say? #
In OpenTelemetry, a failed span has status code 2, so we filter on that and group the result:
$ tq '_time:5m status_code:2 | stats by (name, status_message) count() as spans'
{"name":"POST quote","status_message":"Connect(Resolver(Custom { kind: Uncategorized, error: \"failed to lookup address information: Name or service not known\" }))","spans":"55"}
{"name":"POST /get-quote","status_message":"Internal Server Error","spans":"55"}There are two kinds of failed spans. POST /get-quote is the request that shipping received, and it ended with "Internal Server Error". POST quote is the call that shipping made to quote, and its message has the real reason: "failed to lookup address information: Name or service not known". shipping cannot find quote on the network.
Now let's look at one of these traces in the VictoriaTraces interface:
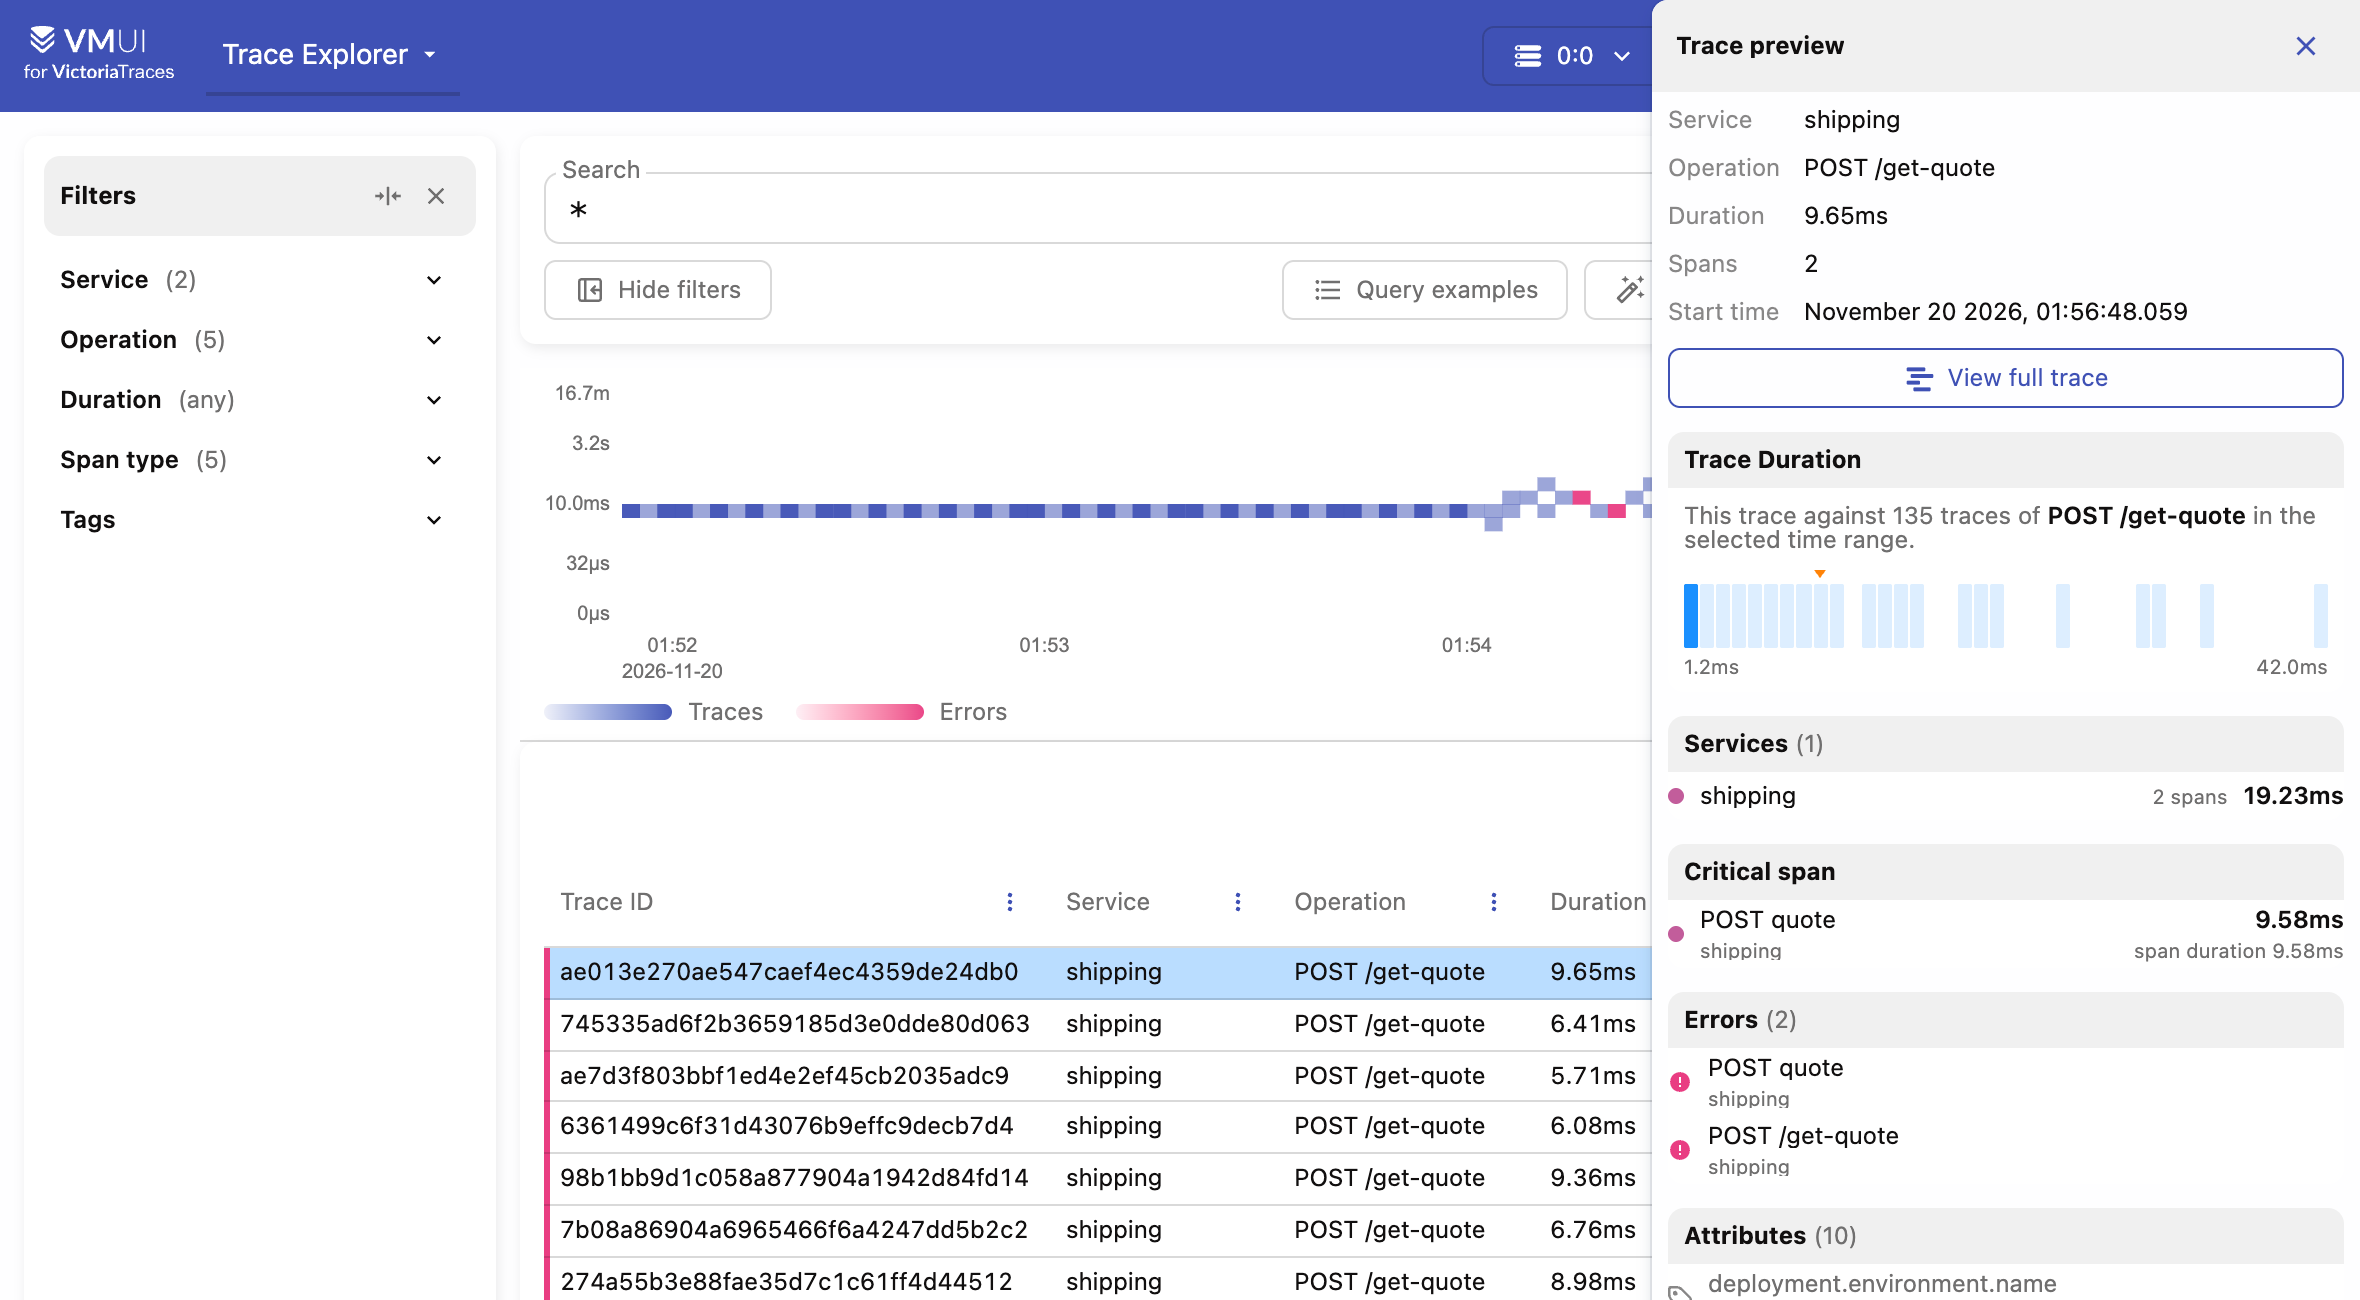
- Open
http://localhost:8427/traces/select/vmui/. The first screen is the Trace Explorer, with the traces of the last five minutes. During the incident, every new row has a red mark and a 2 in the Errors column. - Click one of these rows. A preview opens on the right.
- Click View full trace in the preview.
- On the trace page, click the
POST quotespan. Its fields open on the right.
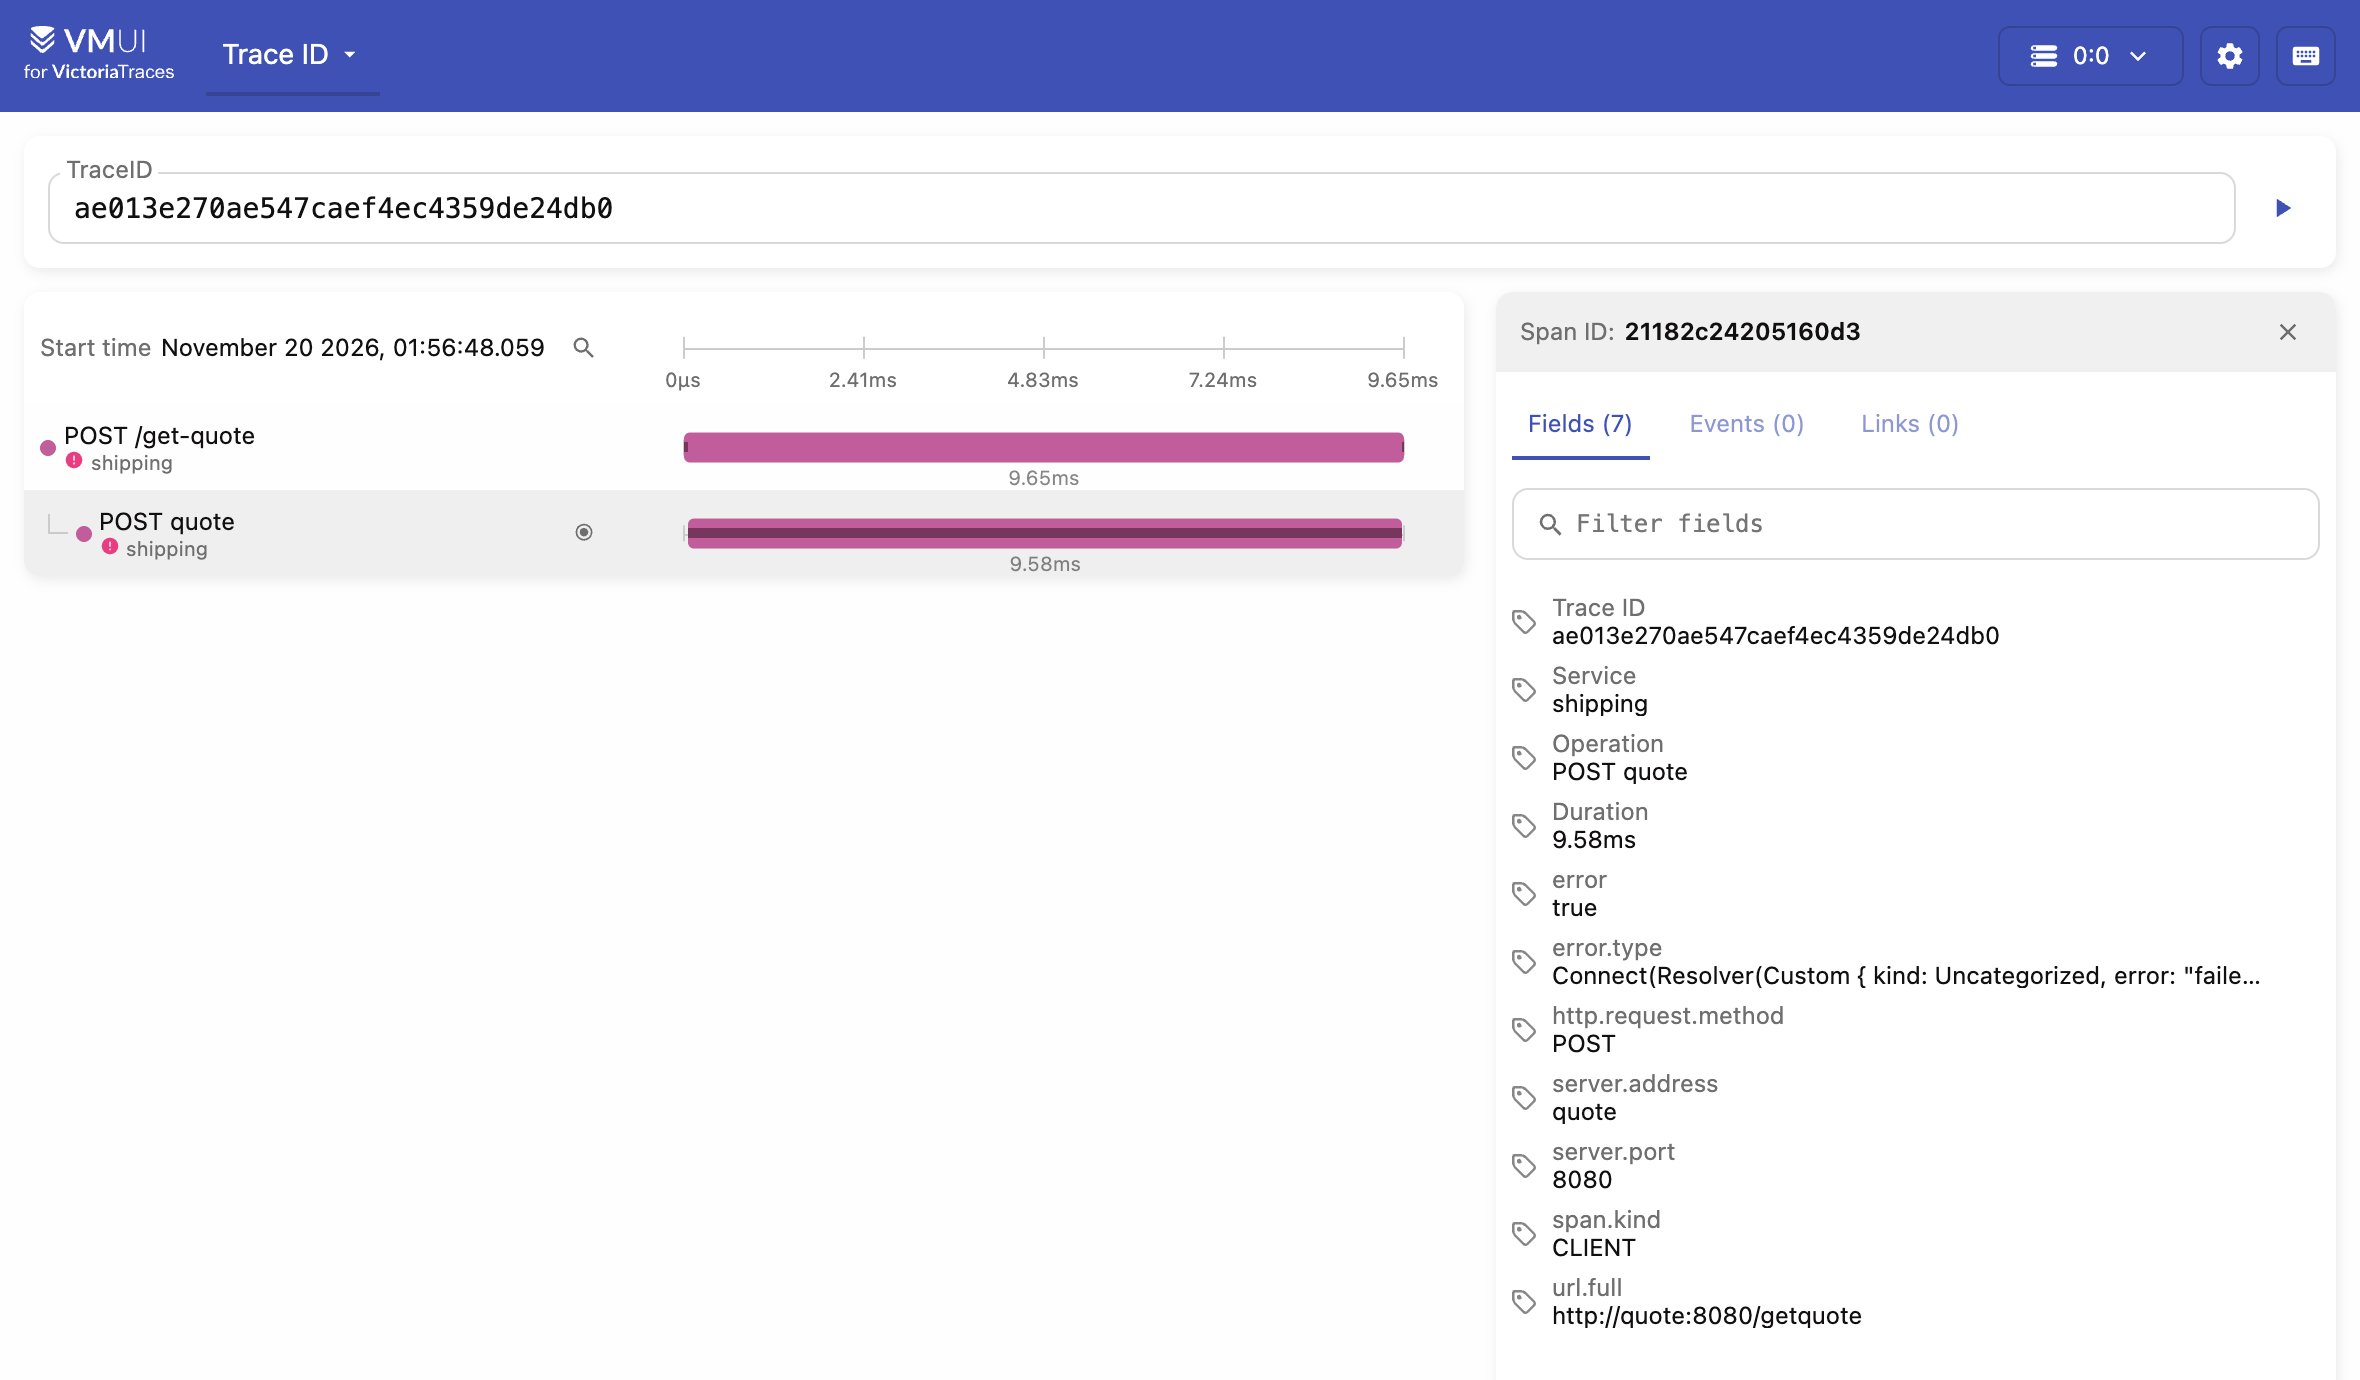
The trace has two spans, and both are marked as errors. In the fields of POST quote, error is true, server.address is quote, and error.type holds the reason we saw above.
The alert fires #
A few minutes later, the alert is firing. In this run, that was a little over six minutes after we stopped quote:
$ curl -s $V/metrics/select/prometheus/api/v1/alerts | jq -c '.data.alerts[] | {alert: .labels.alertname, state}'
{"alert":"RequestErrorsRatioHigh","state":"firing"}
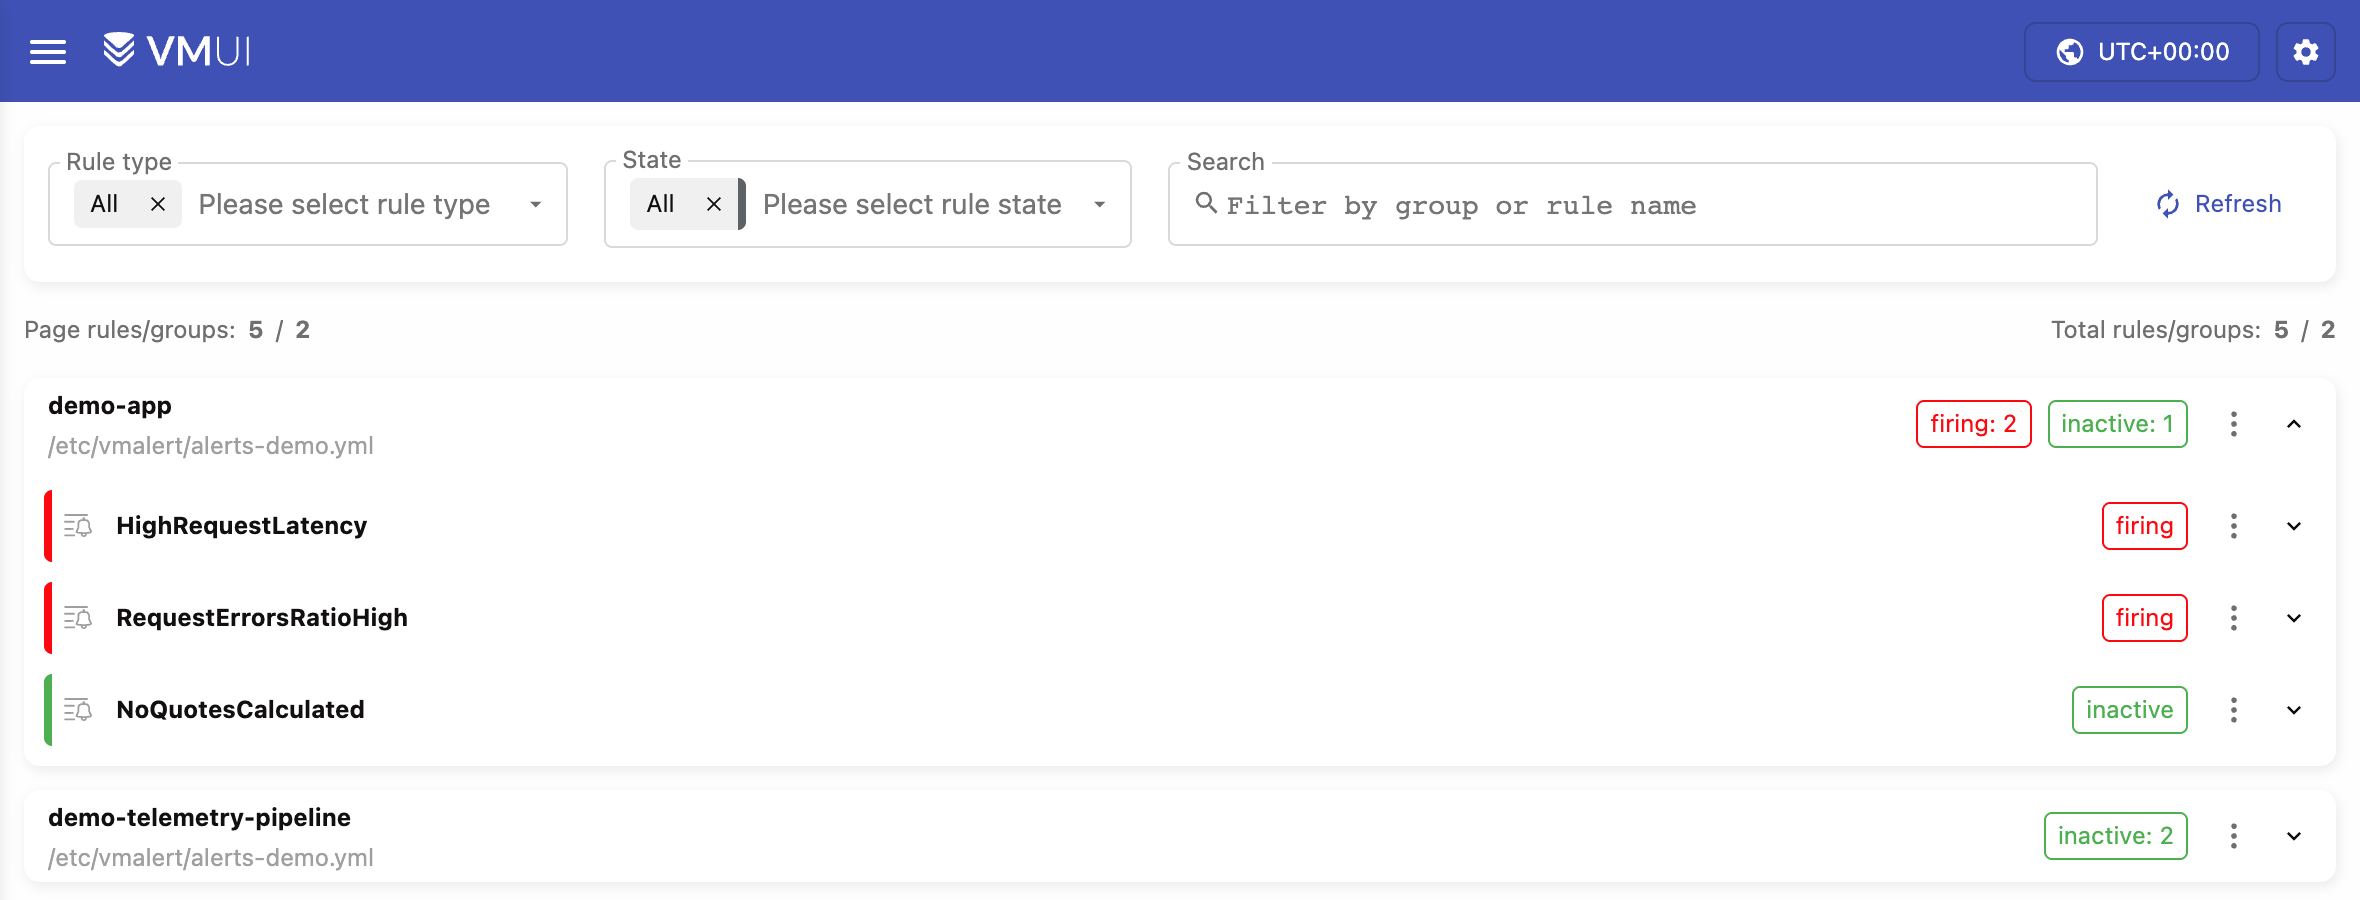
{"alert":"HighRequestLatency","state":"firing"}The VictoriaMetrics interface shows the alerts too. Open http://localhost:8427/metrics/select/vmui/#/rules, which is the Alerting page, and click the demo-app group to open it:
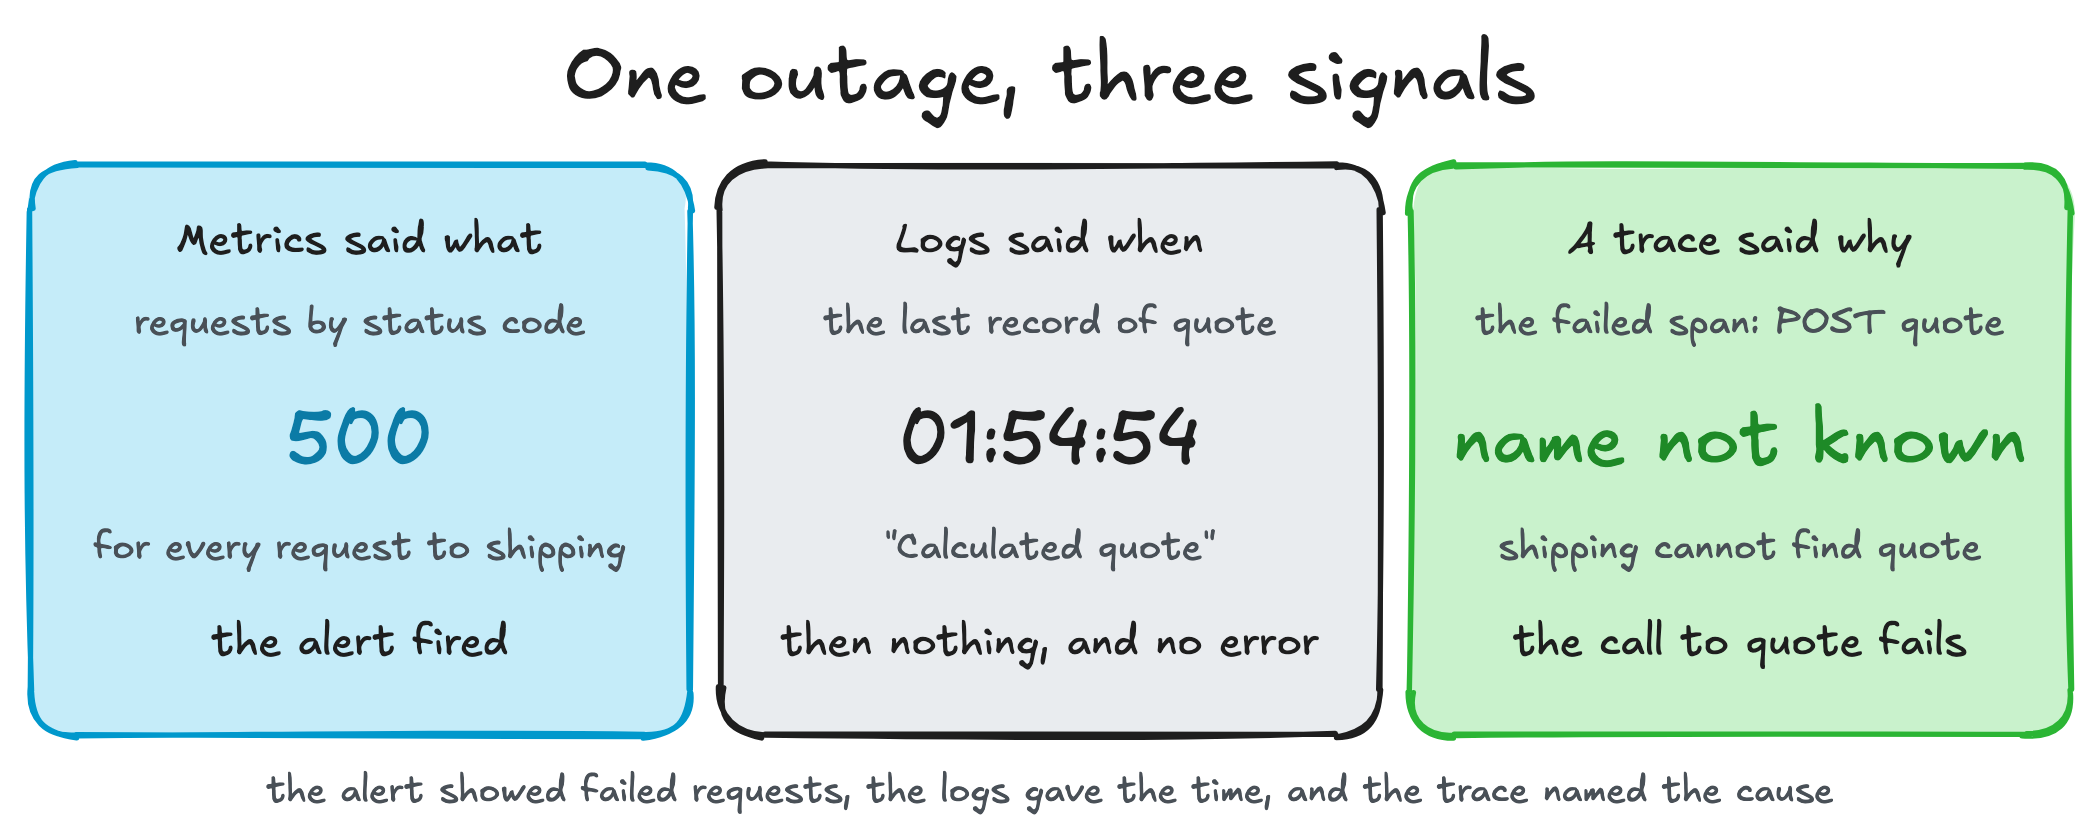
So each signal gave us one part of the answer:
- The metrics and the alert said what is wrong: every request to
shippingfails. - The logs said when it started and which service went quiet:
quotewrote its last record at 01:54:54 UTC. - The trace said why: the call to
quotefails, because the namequotecannot be found.
The same trace in Grafana #
The demo's Grafana has a data source for each database, so the same trace opens there too:
- Open
http://localhost:3000/explore, log in withadminandadmin, and click Skip when Grafana asks for a new password. - Pick VictoriaTraces Jaeger in the data source list at the top.
- The query type is TraceID already. Paste a trace ID into the Trace ID box and press Shift+Enter. You can copy the ID from the TraceID box of the VictoriaTraces trace page.
- Click the
POST quotespan to open its details.
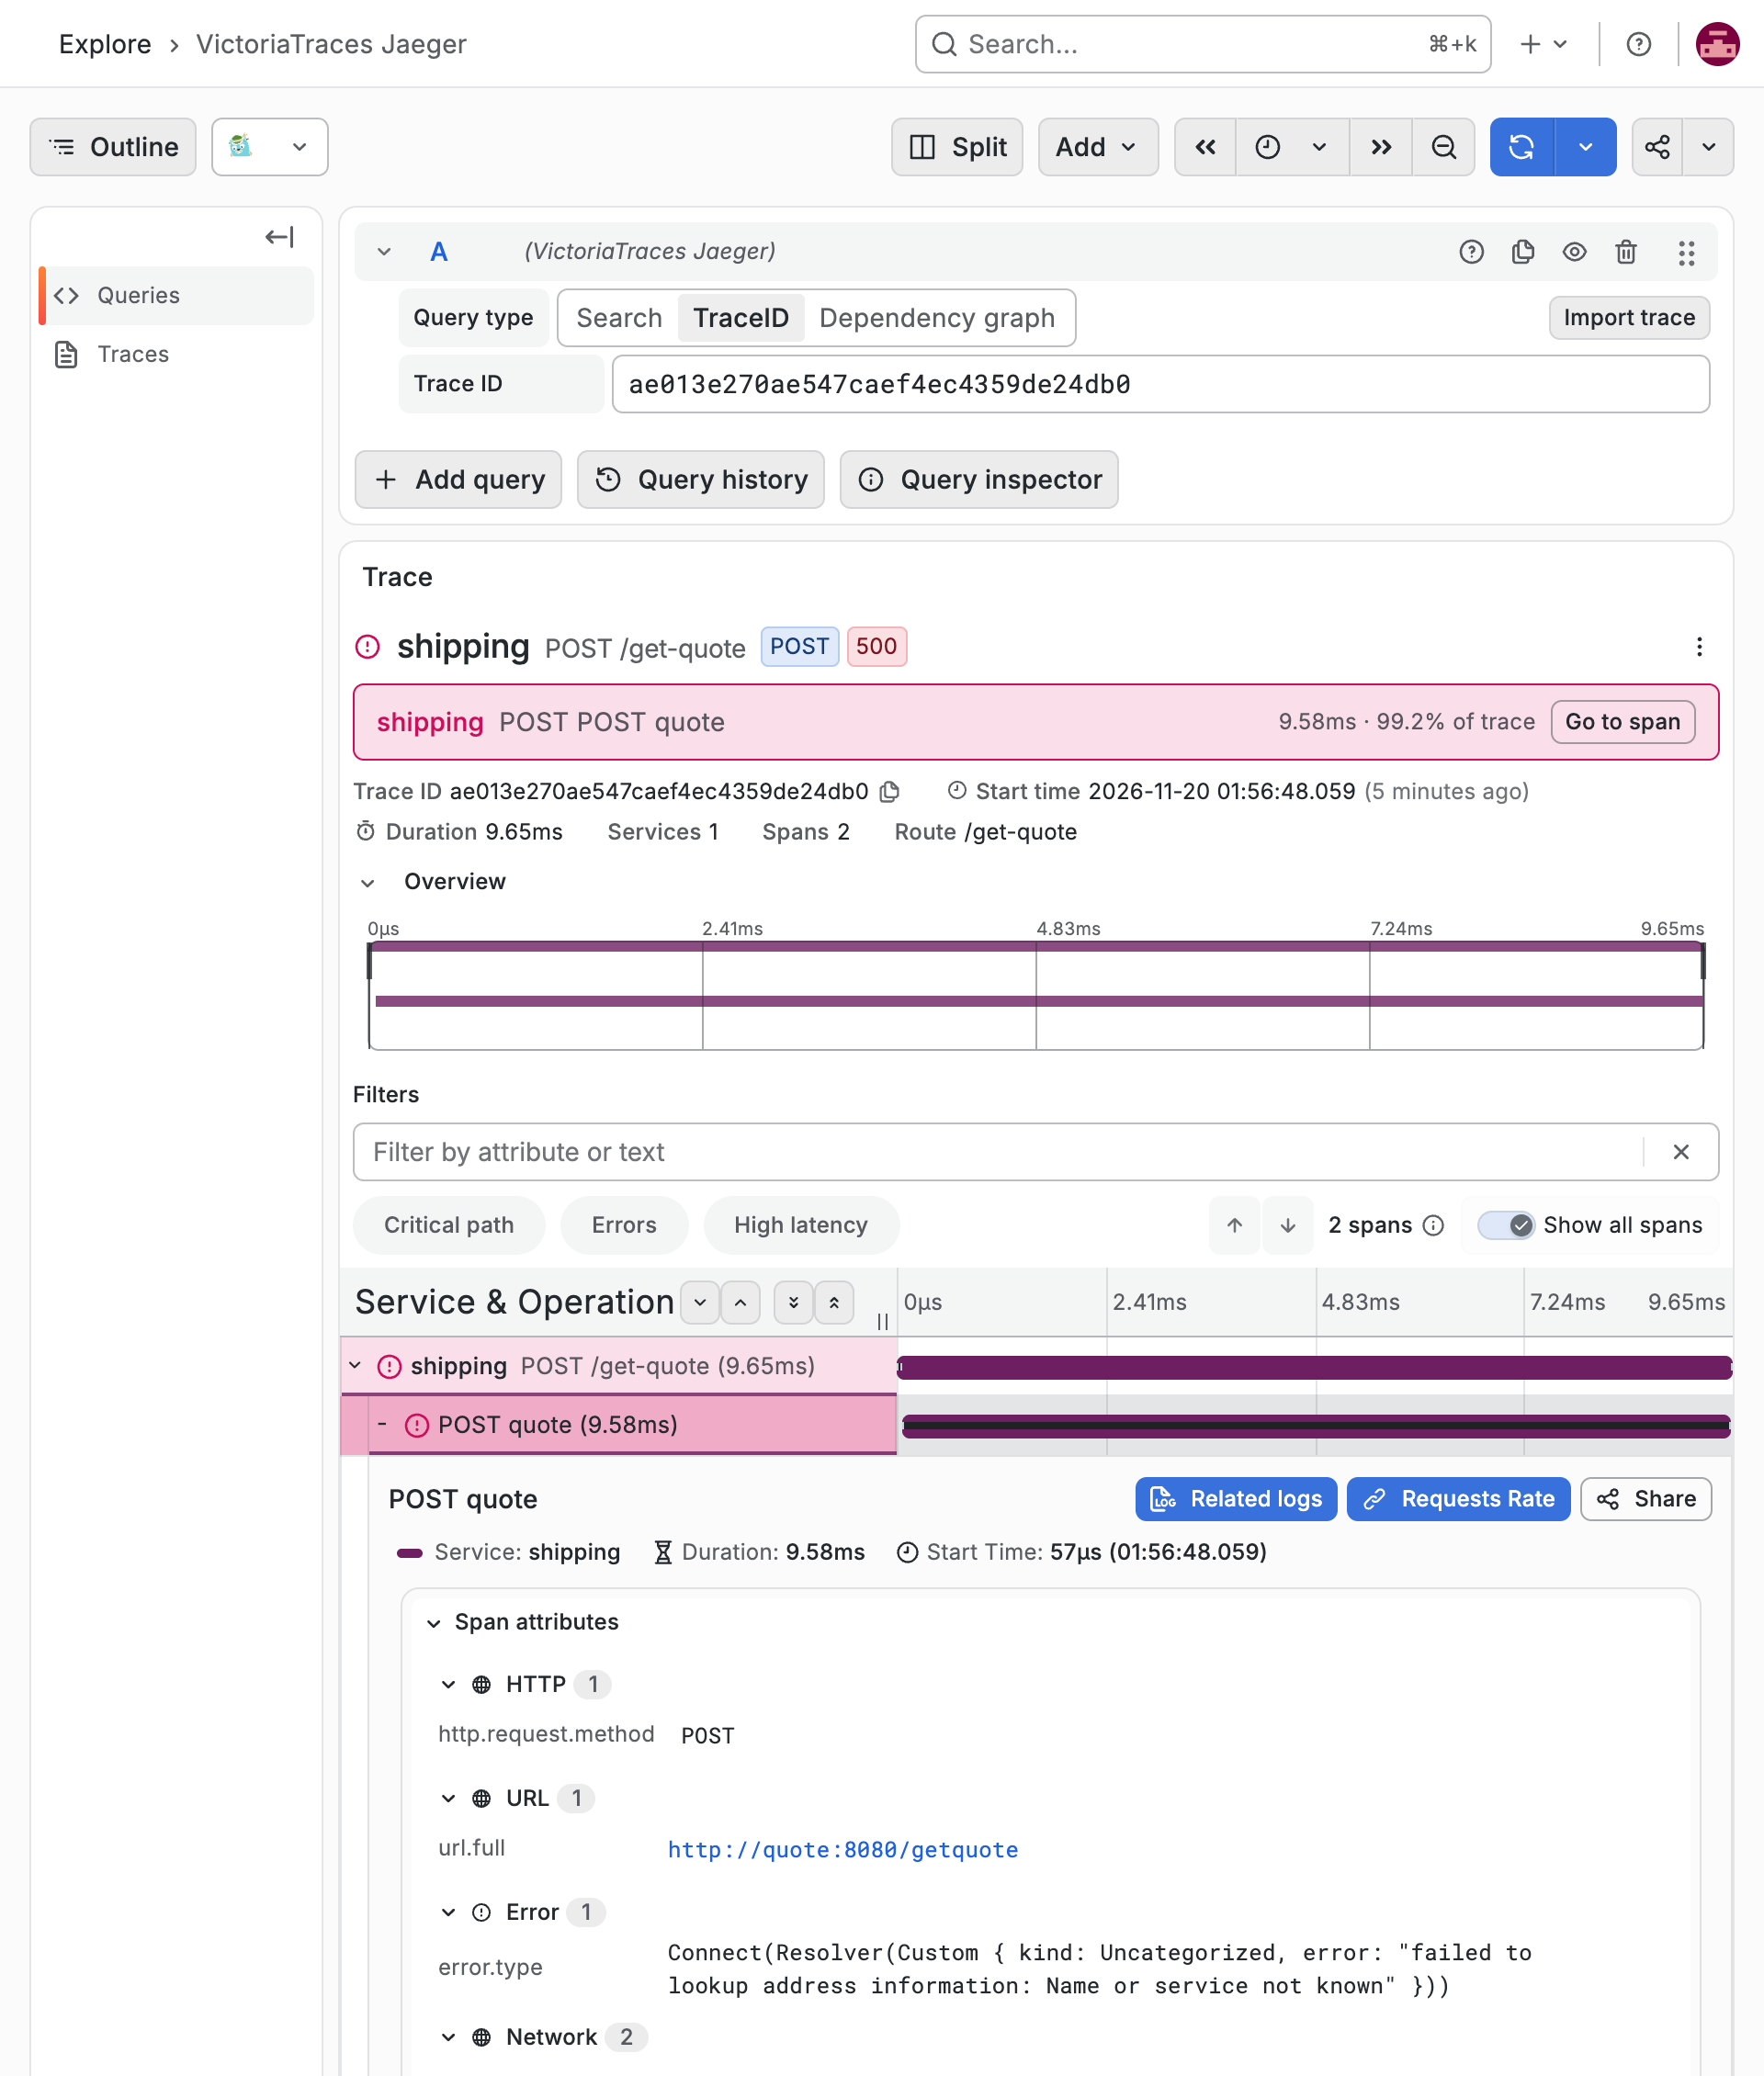
Under Span attributes, the Error group shows error.type with the full message:
Connect(Resolver(Custom { kind: Uncategorized, error: "failed to lookup address information: Name or service not known" }))Read it from the inside out. A name could not be looked up, so the resolver failed, so the connection failed. shipping tried to connect to quote, and nothing on the network answers to that name any more, because we stopped the container.
Fix it #
Start the service again:
$ docker start deployment-quote-1
deployment-quote-1Two minutes later, run the same two queries as before:
$ mq 'sum(rate(http.server.request.duration_count[1m])) by (http.response.status_code)'
{"metric":{"http.response.status_code":"200"},"value":"0.49985004498650404"}
{"metric":{"http.response.status_code":"500"},"value":"0"}

$ lq '_time:2m | stats by (service.name, _msg) count() as logs'
{"service.name":"shipping","_msg":"Sending Quote","logs":"58"}
{"service.name":"quote","_msg":"Calculated quote","logs":"59"}
{"service.name":"shipping","_msg":"Requesting quote","logs":"58"}Compare this with the output during the incident. The two metric lines have swapped their values: status 200 is back at half a request per second, and status 500 is at zero. In the logs, all three messages are back.
Here is the whole incident as a graph in the VictoriaMetrics interface. This link opens the same query on the Graph tab, with the time range set to the last 30 minutes:
http://localhost:8427/metrics/select/vmui/#/?g0.expr=sum%28rate%28http.server.request.duration_count%5B1m%5D%29%29%20by%20%28http.response.status_code%29&g0.range_input=30m&g0.relative_time=last_30_minutes&g0.tab=0You can also do it by hand. Open http://localhost:8427/metrics/select/vmui/, paste the query into the Query box, and click Execute. The time range button is at the top right. If your incident is older than 30 minutes, pick a longer range there.
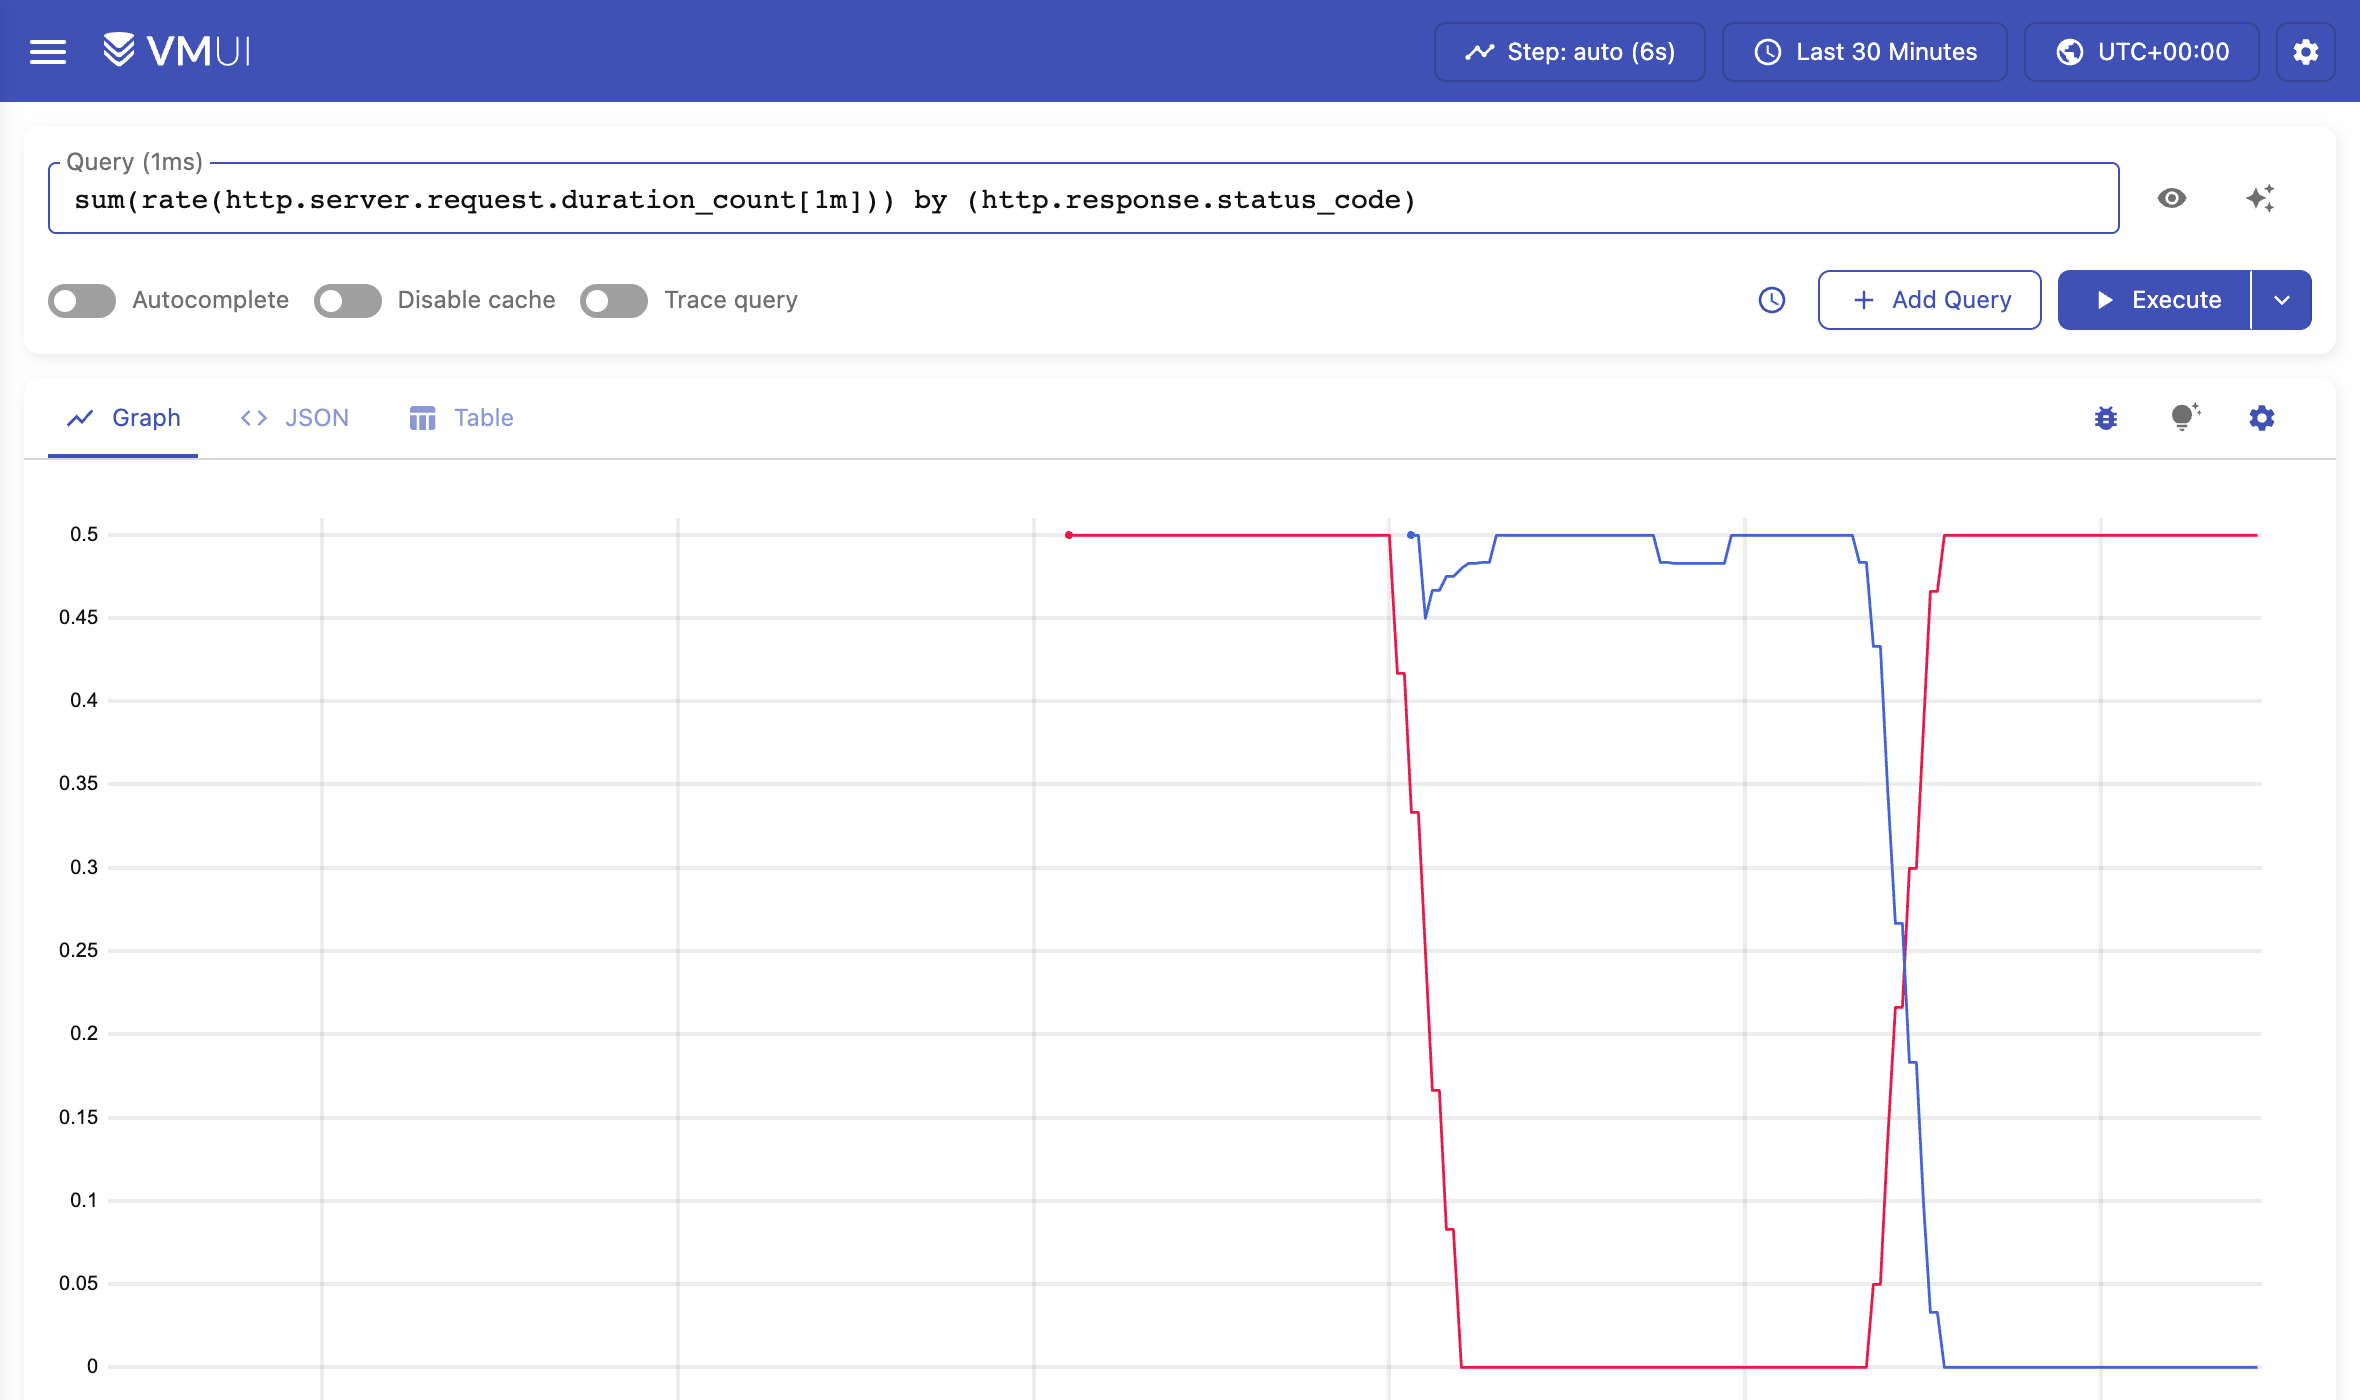
The red line is status 200, and the blue line is status 500. When quote stops, the red line drops to zero and the blue line takes its place. When quote is back, they switch again.
The alert cleared about five and a half minutes after we started quote again. When you are done, stop the stack and delete its data:
$ make otel-single-down
docker compose \
	-f deployment/otel-single-node.yml \
	-f deployment/otel-demo-mini.yml \
	down -v
...
 Volume deployment_vl-data Removed
Network deployment_default Removed Step 6: The cluster version #
So far, each database was one container. This is called the single-node version, and it is the right place to start. When one machine is not enough for your data, each database can also run as a cluster. In the cluster version, the work of one database is split between three kinds of components:
insertreceives new data and passes it to the storage nodesstoragekeeps the data on diskselectanswers queries by reading from the storage nodes
You can run several copies of each one, on different machines.
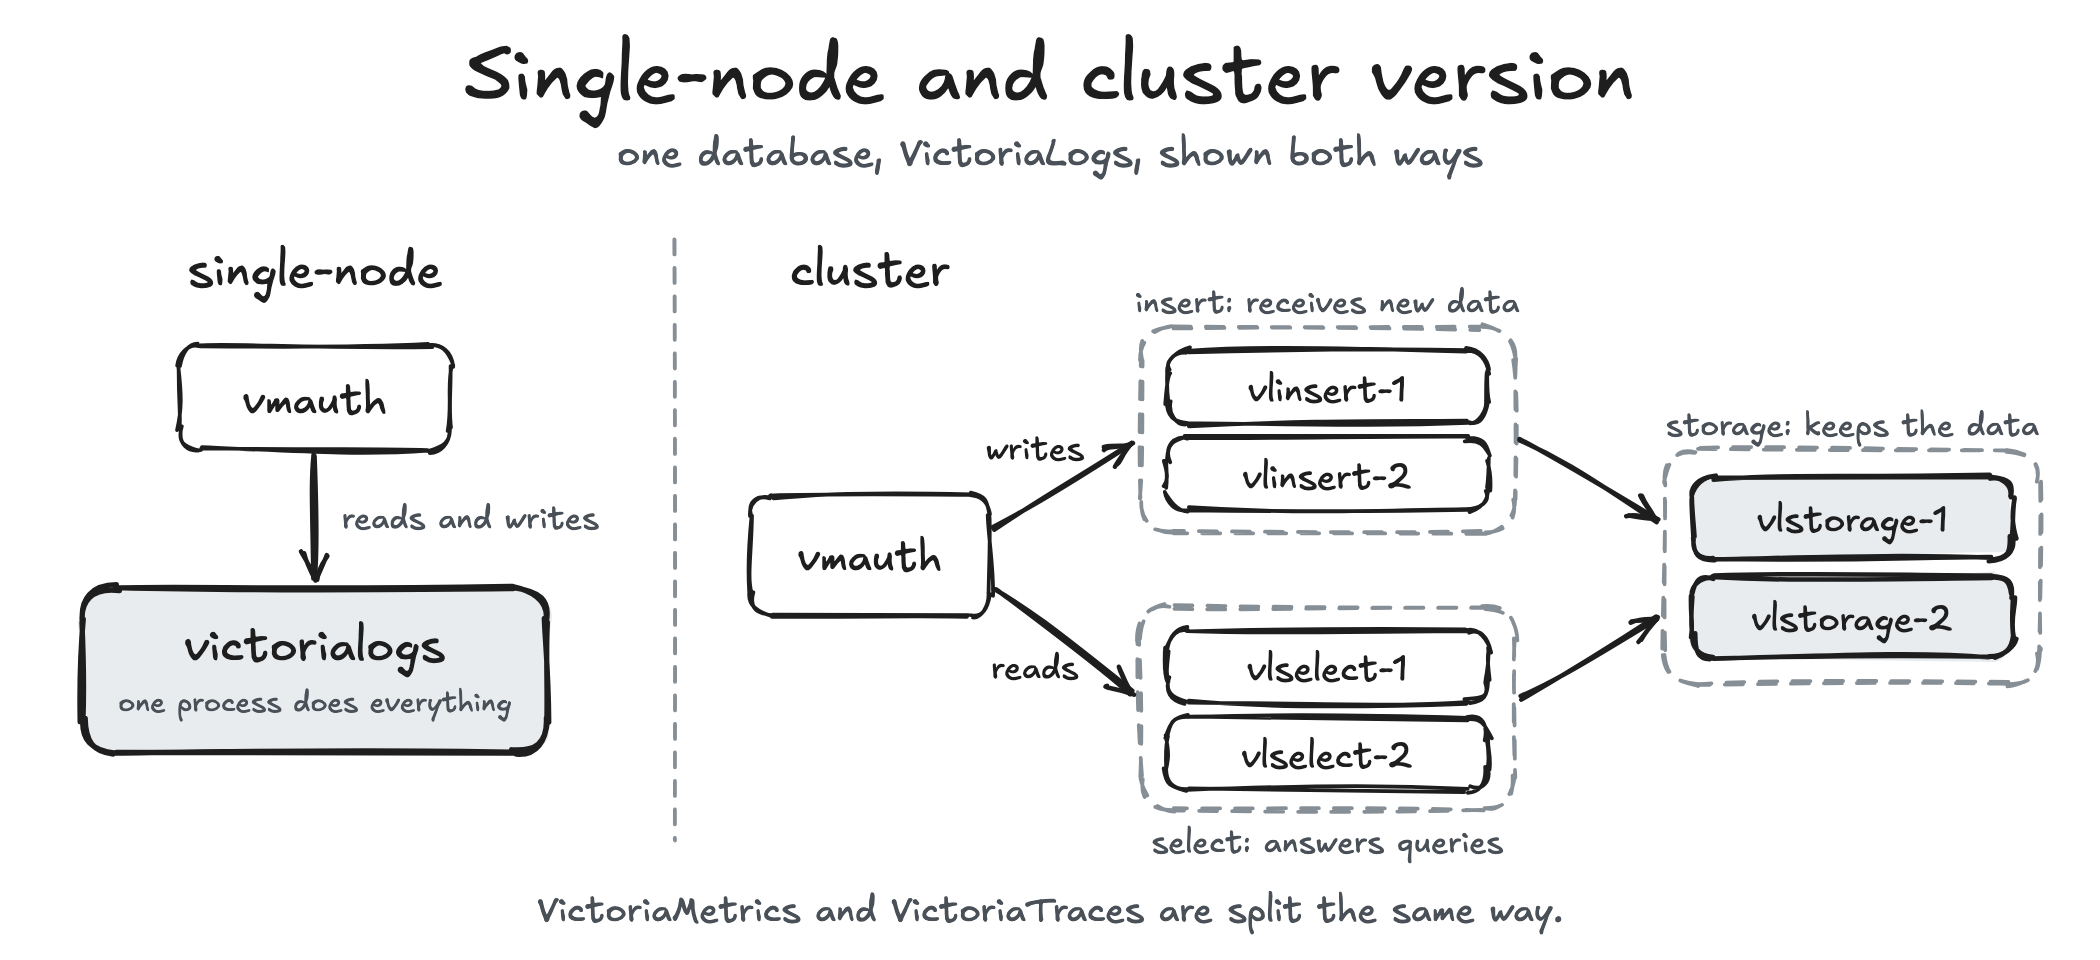
The repo has a second Compose file that starts two copies of each component, for each database:
$ make otel-cluster-up
docker compose \
	-f deployment/otel-cluster.yml \
 	-f deployment/otel-demo-mini.yml \
 	up -d
...
 Container deployment-shipping-1 Started
 Container deployment-traffic-1 Starting
Container deployment-traffic-1 Started Let's look at the containers of one database, VictoriaLogs:
$ docker ps --filter name=deployment-vl --format '{{.Names}}\t{{.Image}}' | sort
deployment-vlinsert-1-1	victoriametrics/victoria-logs:v1.54.0
deployment-vlinsert-2-1	victoriametrics/victoria-logs:v1.54.0
deployment-vlselect-1-1	victoriametrics/victoria-logs:v1.54.0
deployment-vlselect-2-1	victoriametrics/victoria-logs:v1.54.0
deployment-vlstorage-1-1	victoriametrics/victoria-logs:v1.54.0
deployment-vlstorage-2-1 victoriametrics/victoria-logs:v1.54.0Two for insert, two for select, and two for storage. VictoriaMetrics and VictoriaTraces get the same six, so there are 18 database containers now, where there were 3 before. With vmauth, the demo app, and the rest, that makes 27:
$ docker ps --filter name=deployment -q | wc -l
27For the person who queries, nothing changes. vmauth now knows two addresses for every route and spreads the requests between them. After a few minutes, our helpers give the same kind of answers as before:
$ mq 'sum(rate(http.server.request.duration_count[1m])) by (http.route)'
{"metric":{"http.route":"/get-quote"},"value":"0.49995000499950004"}

$ lq '_time:2m | stats by (service.name, _msg) count() as logs'
{"service.name":"shipping","_msg":"Sending Quote","logs":"59"}
{"service.name":"quote","_msg":"Calculated quote","logs":"59"}
{"service.name":"shipping","_msg":"Requesting quote","logs":"59"}

$ curl -s $V/traces/select/jaeger/api/services
{"data":["flagd","quote","shipping"],"errors": null,"limit": 0,"offset": 0,"total":3}The web interfaces are at the same addresses too. Stop it with:
$ make otel-cluster-down
docker compose \
	-f deployment/otel-cluster.yml \
 	-f deployment/otel-demo-mini.yml \
 	down -v
...
Network deployment_default Removed Step 7: Kubernetes with kind and Helm #
Compose is fine for learning. Now let's install the same stack on Kubernetes. For a local cluster, we use kind, because it runs on Linux, macOS, and Windows. Any other local cluster, such as minikube or k3s, will do as well. (On my own Mac, I usually use kiac, Kubernetes in Apple Containers, which is something I built.)
$ kind create cluster --name victoriastack
Creating cluster "victoriastack" ...
 ✓ Ensuring node image (kindest/node:v1.36.1) 🖼
 ✓ Preparing nodes 📦
 ✓ Writing configuration 📜
 ✓ Starting control-plane 🕹️
 ✓ Installing CNI 🔌
 ✓ Installing StorageClass 💾
Set kubectl context to "kind-victoriastack"
...On Kubernetes, the VictoriaMetrics operator runs the databases, and the victoria-metrics-k8s-stack Helm chart installs the operator and everything else. By default, the chart installs only the metrics part. Logs, traces, and vmauth are off. So we turn them on in a file called values.yaml:
# victoria-metrics-k8s-stack values for the post.
# Metrics are on by default. This turns on logs, traces, pod log
# collection, and one vmauth in front of all three databases.
fullnameOverride: stack

vlsingle:
  enabled: true

vtsingle:
  enabled: true

# Collects the logs of every pod and sends them to VictoriaLogs.
vlagent:
  enabled: true

# The single entry point, with the same path prefixes as the Compose demo.
vmauth:
  enabled: true
  spec:
    unauthorizedUserAccessSpec:
      url_map:
        # VictoriaMetrics serves its API from the root, so two parts are removed: /metrics and /select (or /insert).
        - src_paths: ["/metrics/select/.*", "/metrics/insert/.*"]
          drop_src_path_prefix_parts: 2
          url_prefix: ["http://vmsingle-stack:8428"]
        # VictoriaLogs and VictoriaTraces have /select and /insert in their own paths, so only one part is removed.
        - src_paths: ["/logs/select/.*", "/logs/insert/.*"]
          drop_src_path_prefix_parts: 1
          url_prefix: ["http://vlsingle-stack:9428"]
        - src_paths: ["/traces/select/.*", "/traces/insert/.*"]
          drop_src_path_prefix_parts: 1
          url_prefix: ["http://vtsingle-stack:10428"]

# Grafana needs this plugin to get a VictoriaLogs data source.
grafana:
  plugins:
- victoriametrics-logs-datasourceThe url_map gives vmauth the same three path prefixes as in the Compose demo, and the same rule as in Step 2: two parts are removed for metrics, and one for logs and traces. Like the demo, it has no users or passwords, so keep it on a local cluster. Now add the chart repository and install the chart:
$ helm repo add vm https://victoriametrics.github.io/helm-charts/
"vm" has been added to your repositories

$ helm install stack vm/victoria-metrics-k8s-stack --version 0.98.1 --namespace monitoring --create-namespace -f values.yaml
NAME: stack
LAST DEPLOYED: Fri Nov 20 07:37:52 2026
NAMESPACE: monitoring
STATUS: deployed
REVISION: 1
DESCRIPTION: Install complete
NOTES:In this run, the pods were running after about two minutes:
$ kubectl get pods -n monitoring
NAME                                               READY   STATUS      RESTARTS   AGE
stack-grafana-7c74dcc857-xnbjg                     3/3     Running     0          2m10s
stack-kube-state-metrics-f8df5896c-f4fhv           1/1     Running     0          2m10s
stack-prometheus-node-exporter-gxlp6               1/1     Running     0          2m10s
stack-sync-job-cxvjv                               0/1     Completed   0          2m8s
stack-victoria-metrics-operator-566fd744c4-bb79k   1/1     Running     0          2m10s
vlagent-stack-vfbqz                                1/1     Running     0          111s
vlsingle-stack-79b6bb6f44-jhqbz                    1/1     Running     0          106s
vmagent-stack-9cb5cd47f-fndm4                      2/2     Running     0          111s
vmalert-stack-7d65c4966-9fhnh                      2/2     Running     0          111s
vmalertmanager-stack-0                             2/2     Running     0          111s
vmauth-stack-559ffb4649-vw7pk                      2/2     Running     0          111s
vmauth-stack-internal-5476f786f9-62d6b             2/2     Running     0          111s
vmsingle-stack-746794f864-tzcqd                    1/1     Running     0          106s
vtsingle-stack-65b657f49f-2rjlq 1/1 Running 0 111sThe three databases are vmsingle, vlsingle, and vtsingle, and vmauth-stack is our entry point. vmauth-stack-internal is a second vmauth that the chart adds for vmalert. Now let's look at the Service for vmauth:
$ kubectl get svc -n monitoring vmauth-stack
NAME           TYPE        CLUSTER-IP      EXTERNAL-IP   PORT(S)    AGE
vmauth-stack ClusterIP 10.96.187.182 <none> 8427/TCP 111sIt is a ClusterIP Service, so only pods inside the cluster can reach it. To reach it from your machine, forward port 8427 in a second terminal and leave it running. The Compose demo must be stopped by now, because it uses the same port:
$ kubectl port-forward -n monitoring svc/vmauth-stack 8427:8427
Forwarding from 127.0.0.1:8427 -> 8427
Forwarding from [::1]:8427 -> 8427The entry point is at http://localhost:8427 again, the same address as with Compose. So our helpers work without any change. Load them if you are in a new terminal:
$ source helpers.shThere is no demo app in this cluster, but there is data already. vmagent collects the metrics of the cluster, and vlagent collects the logs of every pod:
$ mq 'count(kube_pod_info) by (namespace)'
{"metric":{"namespace":"kube-system"},"value":"8"}
{"metric":{"namespace":"local-path-storage"},"value":"1"}
{"metric":{"namespace":"monitoring"},"value":"14"}

$ lq '_time:5m | stats by (kubernetes.pod_namespace) count() as logs'
{"kubernetes.pod_namespace":"local-path-storage","logs":"28"}
{"kubernetes.pod_namespace":"monitoring","logs":"3101"}
{"kubernetes.pod_namespace":"kube-system","logs":"839"}For traces, we need something that sends spans. Let's send 20 test traces with telemetrygen, a test tool from the OpenTelemetry project:
$ kubectl run telemetrygen -n monitoring --rm -i --restart=Never --image=ghcr.io/open-telemetry/opentelemetry-collector-contrib/telemetrygen:v0.165.0 -- traces --otlp-http --otlp-insecure --otlp-endpoint vmauth-stack:8427 --otlp-http-url-path /traces/insert/opentelemetry/v1/traces --service hello-from-kind --traces 20
...
2026-11-20T02:12:22.050Z	INFO	traces/worker.go:180	traces generated	{"worker": 0, "traces": 20}
2026-11-20T02:12:22.050Z	INFO	traces/traces.go:75	stop the batch span processor
2026-11-20T02:12:22.051Z	INFO	traces/traces.go:65	stopping the exporter
pod "telemetrygen" deleted from monitoring namespace

$ curl -s $V/traces/select/jaeger/api/services
{"data":["hello-from-kind"],"errors": null,"limit": 0,"offset": 0,"total":1}VictoriaTraces shows new spans after about 30 seconds (more on that at the end). So wait a little, and then count the spans:
$ tq '_time:5m name:* | stats by (name) count() as spans'
{"name":"lets-go","spans":"20"}
{"name":"okey-dokey-0","spans":"20"}All three signals answer on Kubernetes, through the same three paths as with Compose. The three web interfaces from Step 2 are at the same addresses too. When you are done, stop the port-forward with Ctrl+C and delete the cluster:
$ kind delete cluster --name victoriastack
Deleting cluster "victoriastack" ...
Deleted nodes: ["victoriastack-control-plane"]A few things to know #
Here are five things we noticed during the runs. Knowing them can save you a few minutes.
HighRequestLatencyfires on a healthy system. Its threshold is 1 ms, which any traffic crosses. Ignore it here, and don't copy it as it is.- Grafana can be slow on a fresh start. It downloads a plugin of about 79 MB before it opens port 3000, so the time depends on your connection. In one of the runs, it took two and a half minutes. If the download fails, the Grafana container exits. Look at
docker logs deployment-grafana-1, and runmake otel-single-upagain. - New spans show up after 30 seconds. Most query APIs of VictoriaTraces leave the newest 30 seconds out by default. That is why we waited before counting the test spans.
- The
shippingSlowdownfeature flag does nothing. The demo defines this flag, but theshippingservice in this image does not read it. That is why we stopped a container to create our incident. helm installmay need a second try. On a new cluster, it can stop withensure CRDs are installed first. It happened to us once. Run the same command again, and it goes through.
Wrapping up #
We started VictoriaStack with two commands, queried metrics, logs, and traces through one port, and then stopped a service and found the cause using all three signals. We also ran the same stack as a cluster and on Kubernetes with kind.
Overall, VictoriaStack is a simple way to run metrics, logs, and traces together, and what I like the most is that nothing is hidden. It is three databases and a proxy, and you can read the config files that connect them in a few minutes. My favourite part is the single entry point with /metrics, /logs, and /traces. Just keep in mind that VictoriaTraces has not reached version 1.0 yet, and for a single view across all three signals you need Grafana for now.
Give it a try on your laptop and let me know how you find it.
Credits and links #
- Thanks to the VictoriaMetrics team for building the stack, the demo, and the docs, and to the OpenTelemetry demo and flagd maintainers for the demo services.
- Announcement: Introducing VictoriaStack: The Right Database for Every Signal
- Docs: VictoriaStack, quick start, deployment, querying, UI integrations, alerting
- Repo with the Compose files: github.com/VictoriaMetrics/VictoriaStack
- Helm chart: victoria-metrics-k8s-stack, and the operator
- Query languages: MetricsQL and LogsQL
- The demo services: OpenTelemetry demo and flagd
Saiyam is working as Head of DevRel at vCluster Labs. He is the founder of Kubesimplify, focusing on simplifying cloud-native & AI infrastructure. He is KubeCon Co-chair and has worked on many facets of Kubernetes, including machine learning platforms, scaling, multi-cloud, & managed Kubernetes services. When not coding, Saiyam contributes to the community by writing blogs and organizing local meetups for Kubernetes and CNCF. He is also a CNCF TAG OpsRes Chair & can be reached on Twitter @saiyampathak.
Get new posts in your inbox.
Spotted a typo or want to improve this post? Edit on GitHub →